
This is a quick post to show you how to import my perceptual color palettes – or any other color palette – into Python and convert them into Matplotlib colormaps. We will use as an example the CIE Lab linear L* palette, which was my adaptation to Matlab of the luminance controlled colormap by Kindlmann et al.
Introduction
You can use the code snippets in here or download the iPython notebook from here (*** please see update ***). You will need NumPy in addition to Matplotlib.
*** UPDATE ***
Fellow Pythonista Matt Hall of Agile Geoscience extended this work – see comment below to include more flexible import of the data and formatting routines, and code to reverse the colormap. Please use Matt’s expanded iPython notebook.
Preliminaries
First of all, get the color palettes in plain ASCII format rom this page. Download the .odt file for the RGB range 0-1 colors, change the file extension to .zip, and unzip it. Next, open the file Linear_L_0-1, which contains comma separated values, replace commas with tabs, and save as .txt file. That’s it, the rest is in Python.
Code snippets – importing data
Let’s bring in numpy and matplotlib:
%pylab inline
import numpy as np
%matplotlib inline
import matplotlib.pyplot as plt
Now we load the data. We get RGB triplets from tabs delimited text file. Values are expected in the 0-1 range, not 0-255 range.
LinL = np.loadtxt('Linear_L_0-1.txt')
A quick QC of the data:
LinL[:3]
gives us:
array
([[ 0.0143,  0.0143,  0.0143],
  [ 0.0404,  0.0125,  0.0325],
  [ 0.0516,  0.0154,  0.0443]])
looking good!
Code snippets – creating colormap
Now we want to go from an array of values for blue in this format:
b1=[0.0000,0.1670,0.3330,0.5000,0.6670,0.8330,1.0000]
to a list that has this format:
[(0.0000,1.0000,1.0000),
(0.1670,1.0000,1.0000),
(0.3330,1.0000,1.0000),
(0.5000,0.0000,0.0000),
(0.6670,0.0000,0.0000),
(0.8330,0.0000,0.0000),
(1.0000,0.0000,0.0000)]
# to a dictionary entry that has this format:
{
'blue': [
(0.0000,1.0000,1.0000),
(0.1670,1.0000,1.0000),
(0.3330,1.0000,1.0000),
(0.5000,0.0000,0.0000),
(0.6670,0.0000,0.0000),
(0.8330,0.0000,0.0000),
(1.0000,0.0000,0.0000)],
...
...
}
which is the format required to make the colormap using matplotlib.colors. Here’s the code:
b3=LinL[:,2] # value of blue at sample n
b2=LinL[:,2] # value of blue at sample n
b1=linspace(0,1,len(b2)) # position of sample n - ranges from 0 to 1

# setting up columns for list
g3=LinL[:,1]
g2=LinL[:,1]
g1=linspace(0,1,len(g2))

r3=LinL[:,0]
r2=LinL[:,0]
r1=linspace(0,1,len(r2))

# creating list
R=zip(r1,r2,r3)
G=zip(g1,g2,g3)
B=zip(b1,b2,b3)

# transposing list
RGB=zip(R,G,B)
rgb=zip(*RGB)
# print rgb

# creating dictionary
k=['red', 'green', 'blue']
LinearL=dict(zip(k,rgb)) # makes a dictionary from 2 lists
Code snippets – testing colormap
That’s it, with the next 3 lines we are done:
my_cmap = matplotlib.colors.LinearSegmentedColormap('my_colormap',LinearL)
pcolor(rand(10,10),cmap=my_cmap)
colorbar()
which gives you this result: 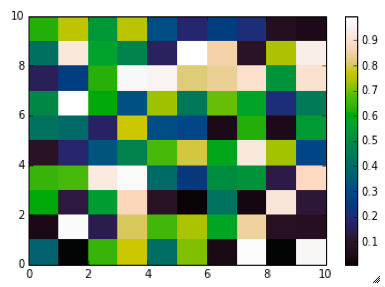 Notice that if the original file hadn’t had 256 samples, and you wanted a 256 sample color palette, you’d use the line below instead:
my_cmap = matplotlib.colors.LinearSegmentedColormap('my_colormap',LinearL,256)
Have fun!
Related Posts (MyCarta)
The rainbow is dead…long live the rainbow! – Part 5 – CIE Lab linear L* rainbow
Visualize Mt S Helens with Python and a custom color palette
A bunch of links on colors in Python
http://bl.ocks.org/mbostock/5577023
http://matplotlib.org/api/cm_api.html
http://matplotlib.org/api/colors_api.html
http://matplotlib.org/examples/color/colormaps_reference.html
http://matplotlib.org/api/colors_api.html#matplotlib.colors.ListedColormap
http://wiki.scipy.org/Cookbook/Matplotlib/Show_colormaps
http://stackoverflow.com/questions/21094288/convert-list-of-rgb-codes-to-matplotlib-colormap
http://stackoverflow.com/questions/11647261/create-a-colormap-with-white-centered-around-zero
This is brilliant, Matteo! I will definitely be using your famous colourmaps in my stuff. Very cool.
Check this out. I extended the start of your workflow to do some of the formatting in Python too… and found three ways to reverse a colourmap too. This was a great exercise in getting to know Matplotlib colourmaps better — thanks for the motivation!
Hey Matt
Awesome job, thanks for chipping in, and for giving me some more motivation too! I’m going to sit down tonight and work through your examples. 🙂
And thanks for loading a Notebook on Github. I have to sign up and get myself in there too.
By the way, I was going to use part of the the iPython Notebook as an intro to my tutorial article for The Leading Edge, I’m thinking of incorporating some of your additions if that’s OK.
Hey, yes, GitHub is great. I honestly don’t think I could live without it anymore. Do join… there is a good number of geoscientists in there and it’s fun to poke around in other people’s stuff.
Totally fine to do whatever you like with my notebooks etc… I just really appreciate you going over all this. I’ve meant to look at Matplotlib colourmaps for months, but it makes such a difference when someone gets you started!
Getting from the arrays to the dictionary gave me a few head scratches particularly because I was learning Python as I went, but wanting to get my palettes in was a motivation. I just added a list at the bottom of the post with a bunch of good links on colormaps in Python.
I went through the second part of your work again, I like how you made a gen_cmap function, but my favourite is the flipud. Simple, elegant (and perhaps because I used it soo much in Matlab).
Matteo, this is really cool stuff, thanks for sharing!
To add a bit to Matts code, instead of reading the data from file (raw_data =
f.read()) and then converting everything from strings, to numbers, to array,
you could just pass f to numpy.loadtxt and that already gets you an array. You
can even set the delimeter to ‘;’ so it reads csv directly.
I’d love to include these as an option (or maybe the default) in Fatiando.
Would that be ok with you? If so, what is the license for these palettes?
Also, have you considered putting them on figshare.com? I’d be more than happy
to cite it if/when I use them in a publication (and put a link in the Fatiando
docs).
Hi Leonardo
Thanks for your input. I did originally use the numpy loadtxt but did not think of checking for separator option. I’ll try that. I also like Matt’s idea of getting the file straight off the website. Good to have both options.
As for the palettes, if you want to include them in Fatiando, go for it, I’d be delighted! My original motivation was to get as many people as possible to drop rainbow/spectrum altogether. The more people, the merrier. I do not have a standard license on the blog stuff (check my Konomark sharing agreement at bottom). You asked, I say use them however you like. If you can include a link to the post, that’s great.
OK, I’ll try to think of a way to include them in fatiando.vis.mpl (http://fatiando.readthedocs.org/en/latest/api/vis.mpl.html), my wrapper for matplotlib. I might extend the pyplot.cm module when I import it to include your palettes. Or maybe make a separate module for them. Do you have any suggestions?
I confess I’m too inexpereinced still with Python. I have to defer to you. 🙂
One more thing Leonardo: I’m writing this tutorial for The Leading Edge on color palettes. It will be out in August. Same series as your Euler Deconvolution tutorial in Fatiando. As part of that I’m planning to include for sure a version of the improved grayscale from Froner et al. plus either a new grayscale specifically designed for fault interpretation on seismic data, or a new two-color divergent palette. The notebook may have all of them. If you want, when they are ready, I can give you a preview so you can decide if you want to include any of those too.
Sure, I’d love that!
Pingback: Visualize Mt St Helen with Python and a custom color palette | MyCarta
Dear Matteo, Thanks a lot for this post. Simple and Brilliant way that helped me to understand matplotlib colromap manipulation better
I am glad it helped
Hi Matteo,
I am novice in matplotlib and you are my only hope for my question: Do you know if it is possible to create a matplotlib colormap from a color palette with values between 0 and 255 (so not only 0-1 values)?
Thank you very much for your answer and sorry for my english
Hello Amy
If your input palette has values between 0-255, you only need to divide all values by 255 to get them in the range 0-1, then you can use the code in this post. Let me know if you are successful. Matteo
Hello,
thanks four your answer, It works fine now!!! I appreciate your time and
wish you much success with your projects.
Amy
Hello Matteo, thanks for the excellent job. I could improve the visualization of my data using this colormap. Have you had the opportunity to convert it to grayscale?
Thanks for the positive feedback Felipe.
As for your question: a colormap is made of R,G,B values just like an image, so you can convert it to gray just like an image. I would try rgb2gray if you are working in Matlab https://www.mathworks.com/help/matlab/ref/rgb2gray.html
In Python, I show how to convert RGB to intensity in this tutorial notebook (Python 2): https://github.com/seg/tutorials-2014/blob/master/1408_Evaluate_and_compare_colormaps/How_to_evaluate_and_compare_colormaps.ipynb
Different conversion methods give slightly different results, that is why I often do it myself, as in the tutorial, depending on the objective. See this article, it was an eye-opener for me: http://www.tannerhelland.com/3643/grayscale-image-algorithm-vb6/
Matteo
Hi Matteo,
thanks, I’m using python and it worked like a charm!
I’m amazed with all these information about grayscale and also colormaps. For sure its a important aspect of the research to show the results.
Felipe