
Evan Bianco of Agile Geoscience wrote a wonderful post on how to use python to import, manipulate, and display digital elevation data for Mt St Helens before and after the infamous 1980 eruption. He also calculated the difference between the two surfaces to calculate the volume that was lost because of the eruption to further showcase Python’s capabilities. I encourage readers to go through the extended version of the exercise by downloading his iPython Notebook and the two data files here and here.
I particularly like Evan’s final visualization (consisting of stacked before eruption, difference, and after eruption surfaces) which he created in Mayavi, a 3D data visualization module for Python. So much so that I am going to piggy back on his work, and show how to import a custom palette in Mayavi, and use it to color one of the surfaces.
Python Code
This first code block imports the linear Lightness palette. Please refer to my last post for instructions on where to download the file from.
import numpy as np
# load 256 RGB triplets in 0-1 range:
LinL = np.loadtxt('Linear_L_0-1.txt')
# create r, g, and b 1D arrays:
r=LinL[:,0]
g=LinL[:,1]
b=LinL[:,2]
# create R,G,B, and ALPHA 256*4 array in 0-255 range:
r255=np.array([floor(255*x) for x in r],dtype=np.int)
g255=np.array([floor(255*x) for x in g],dtype=np.int)
b255=np.array([floor(255*x) for x in b],dtype=np.int)
a255=np.ones((256), dtype=np.int); a255 *= 255;
RGBA255=zip(r255,g255,b255,a255)
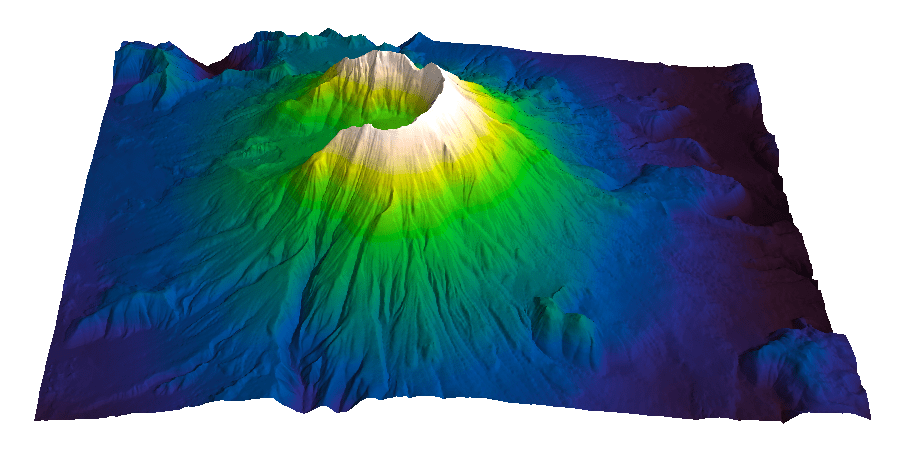
This code block imports the palette into Mayavi and uses it to color the Mt St Helens after the eruption surface. You will need to have run part of Evan’s code to get the data.
from mayavi import mlab
# create a figure with white background
mlab.figure(bgcolor=(1, 1, 1))
# create surface and passes it to variable surf
surf=mlab.surf(after, warp_scale=0.2)
# import palette
surf.module_manager.scalar_lut_manager.lut.table = RGBA255
# push updates to the figure
mlab.draw()
mlab.show()
Reference
Mayavi custom colormap example
Related Posts (MyCarta)
The rainbow is dead…long live the rainbow! – Part 5 – CIE Lab linear L* rainbow
Convert color palettes to Python Matplotlib colormaps
Pingback: Convert color palettes to Python Matplotlib colormaps | MyCarta
The so called “gist_earth” colormap available in Matplotlib and Mayavi is pretty good, but it probably isn’t as good as one of your perceptually balanced colormaps. Any opinion on how good or how bad it is by comparison? I think that I resort to using it because it is easy, and it is just there as a keyword argument, but it also have the look and feel of a topographic map. With that said your surface looks much more vibrant. Keep up the awesome work!
Hi Evan
Good question. I was wondering about it too. I confess that if I look at them both without getting too much into the perception corner, I get a more pleasant feeling from the gist_earth. I find it a bit more “earthy” whereas the Linear Lightness could be a touch too vibrant….
Certainly the gist_earth is the best “default” I’ve seen so far.
If I look at it more from the point of view of perception, I see that brownish transition between yellow-green and white as a potential place for perceptual artifacts. I’ll run some of my tests on it and get back to you. Great data, thanks for sharing!
notebook corrupt?
”
Error loading notebook
Unreadable Notebook: C:\LEARN\Python\Surfaces\MtHelen\Mt_St-Helens.ipynb NotJSONError(“Notebook does not appear to be JSON: u’\\n\\n\\n\\n\\n\\n\\n\\n\\n\\n<ht…",)
"
I don’t think so, I just tried it myself. Sometimes the direct download off of Jupyter does not work, but in those cases I just copy the link and paste it in nbviewer and download it from there and it always works.